

Business Intelligence Begins with Project Management
Whether your business intelligence tools will provide any actual intelligence is determined long before the need to report on status. The difference between a tool that repeats what you already know and one that tells you what you should be doing is a function of project management.
This runs against how most organizations think about business intelligence. When clients say they need a dashboard, the request is usually read as a call for a data-analytics-and-visualization product—a dashboard, a tracker, a report—built sometime after the project starts to read out the state of the engagement. Intelligence is assumed to live in the visualization of the data, even when that visualization shows little more than the pivot tables that came before it. But intelligence doesn’t come from KPIs, and it can’t be extracted from individuals reporting out a RAG status.
When BI requires a new build every reporting cycle or depends on connections to sources disconnected from the work it’s meant to capture, the instinct is to fix the build. That instinct reveals an underlying assumption: the field of data analytics and visualization is ultimately separate from the discipline of project management. PM controls the work; BI is a layer stood up later to report on it. This seems intuitively correct, but it fails in practice at scale and under complexity. The single most important factor in whether BI tools are intelligent is set upstream, when the work is first decomposed into a project plan. To understand why, we must first understand what we mean by “intelligence.”
Business Intelligence, as first defined in 1958, centered on the interrelationships among facts, “…in such a way as to guide action towards a desired goal” (Luhn, 1958, IBM). Modern definitions emphasize the tools of BI—modeling, analysis, and data visualization—but maintain that the objective of these is “to support informed decision making and value creation” (Gartner Peer Insights, 2026). In other words, data alone isn’t sufficiently intelligent. In a business context, a relational element is required; one that moves beyond “where are we?” toward “what should I do?”.

The connection to project management becomes visible when you examine the most common visualization in any report: status. For a BI tool to actually be intelligent—not just appear intelligent—the data feeding it must be trustworthy and structurally sound. The tool may seem intelligent, but how can we be sure? We can examine this by looking at status itself.
Of the many ways that one can indicate the performance of any piece of work, there are two main classes: assigned status and derived status.
- Assigned status is a judgment of performance based on individual knowledge and recorded as a metric. This is essentially an opinion, which can be challenged only by a competing opinion. Variations of this method include RAG and narrative statuses, confidence polling or surveys, and executive judgement.
- Derived status is a calculated read-out of underlying data, based on business rules. In project and program management, Earned Value Management (EVM) provides a method for calculating project performance—combining scope, time, and cost measurements to predict project success.
The enabling condition of intelligent BI tools requires that data is organized so that it can be stacked together to create insights, reporting, and status. This is only consistently achievable through derived status, and it is a function of how projects are structured from the beginning, not a function of data visualization and analytics.
A common misconception about derived status is that it requires tedious capture of performance data. In fact, EVM metrics require only the capture of whether planned work has been completed—and when. This is achieved by decomposition of work following a set of fundamental principles:
- Entity Separation: deliverables, activities, risks, issues, and dependencies exist as distinct, addressable objects
- Relational Association: every object is tied to the work it affects – a risk to the activities it threatens, an issue to its deliverable
- Hierarchical Coherence: dates, ownership, and scope reconcile across levels, so a milestone’s date squares with every activity beneath it
- Business Rules: the logic encoding what “on track” and “at risk” actually mean, grounded in EVM metrics
Together, these provide the conditions under which intelligent reporting becomes possible. Intelligent visualization is enabled by the data relationships beneath it. Those relationships depend on a coherent schema across sources; the schema is only as good as the integrity of the data feeding it; integrity depends on accurate, objective reporting; and objective reporting depends on the work having been decomposed in the first place.
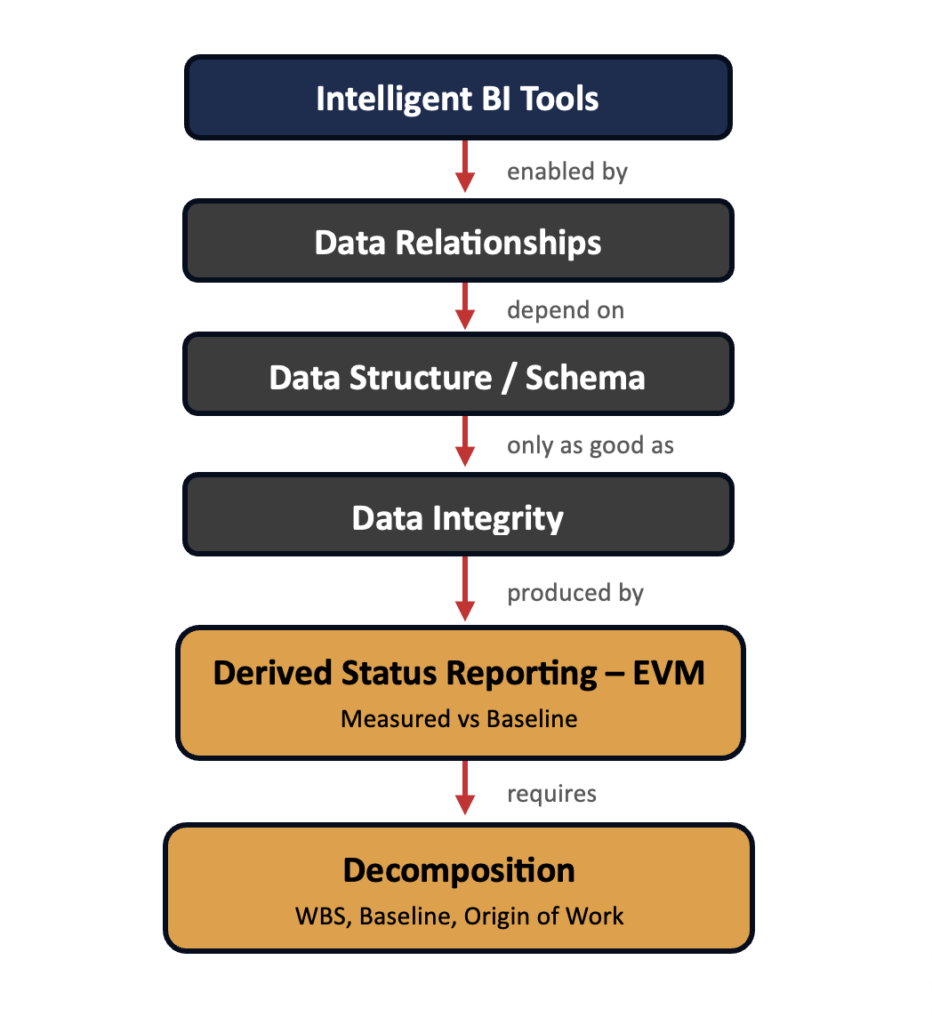
By the time anyone asks for a dashboard, every layer above has already been determined by the ones beneath it. Intelligent BI is an outcome of considering project management principles from the start—achievable at little additional cost to executing PM best practice on its own, and a powerful enabler for complex engagements where rework isn’t an option mid-flight.
One might think that all of this, as nice as it sounds in theory, is ultimately a target state in practice—a nice-to-have. But this view underestimates the unlock that this way of reporting provides under complexity. As projects grow in size and in ambiguity, knowing that some workstreams have a status of “amber” matters less than being able to anticipate downstream failure and, when marks are missed, to understand why. An assigned status invites the question of whether that status is fair, while a derived status answers the question before it had to be asked: “what should I do?”.
Risk shifts from an abstraction that generally threatens project success to a defined object that can be unflinchingly accepted and contained as an element of the work. Escalation becomes agnostic to the intensity with which issues are raised, and completeness metrics reflect the true state of execution rather than someone’s estimate of it. Changes to capacity or scope become defensible choices in any given circumstance and generate lessons learned that vigorously mature the organization.
But the largest payoff is composability. Project data structured this way can be combined with data collected in the ordinary course of business: financial reporting, readiness metrics, and an organization’s own definition of value. When integrated into a company’s operations, the result is an ability to answer the bigger questions driving investment: which initiatives are working and which to sunset, and whether a system should be retired or modernized. Reporting expands beyond a high-level tool and provides value to team members tracking activities, managers running workstreams, and portfolio executives alike: both a microscope and a telescope pointed inward.
Ineffective Business Intelligence reports are not a problem of reporting itself—when the call next comes to create a dashboard, start by reviewing the project plan.


